Created by Ji Jin (Jack) Chen
Source ↗
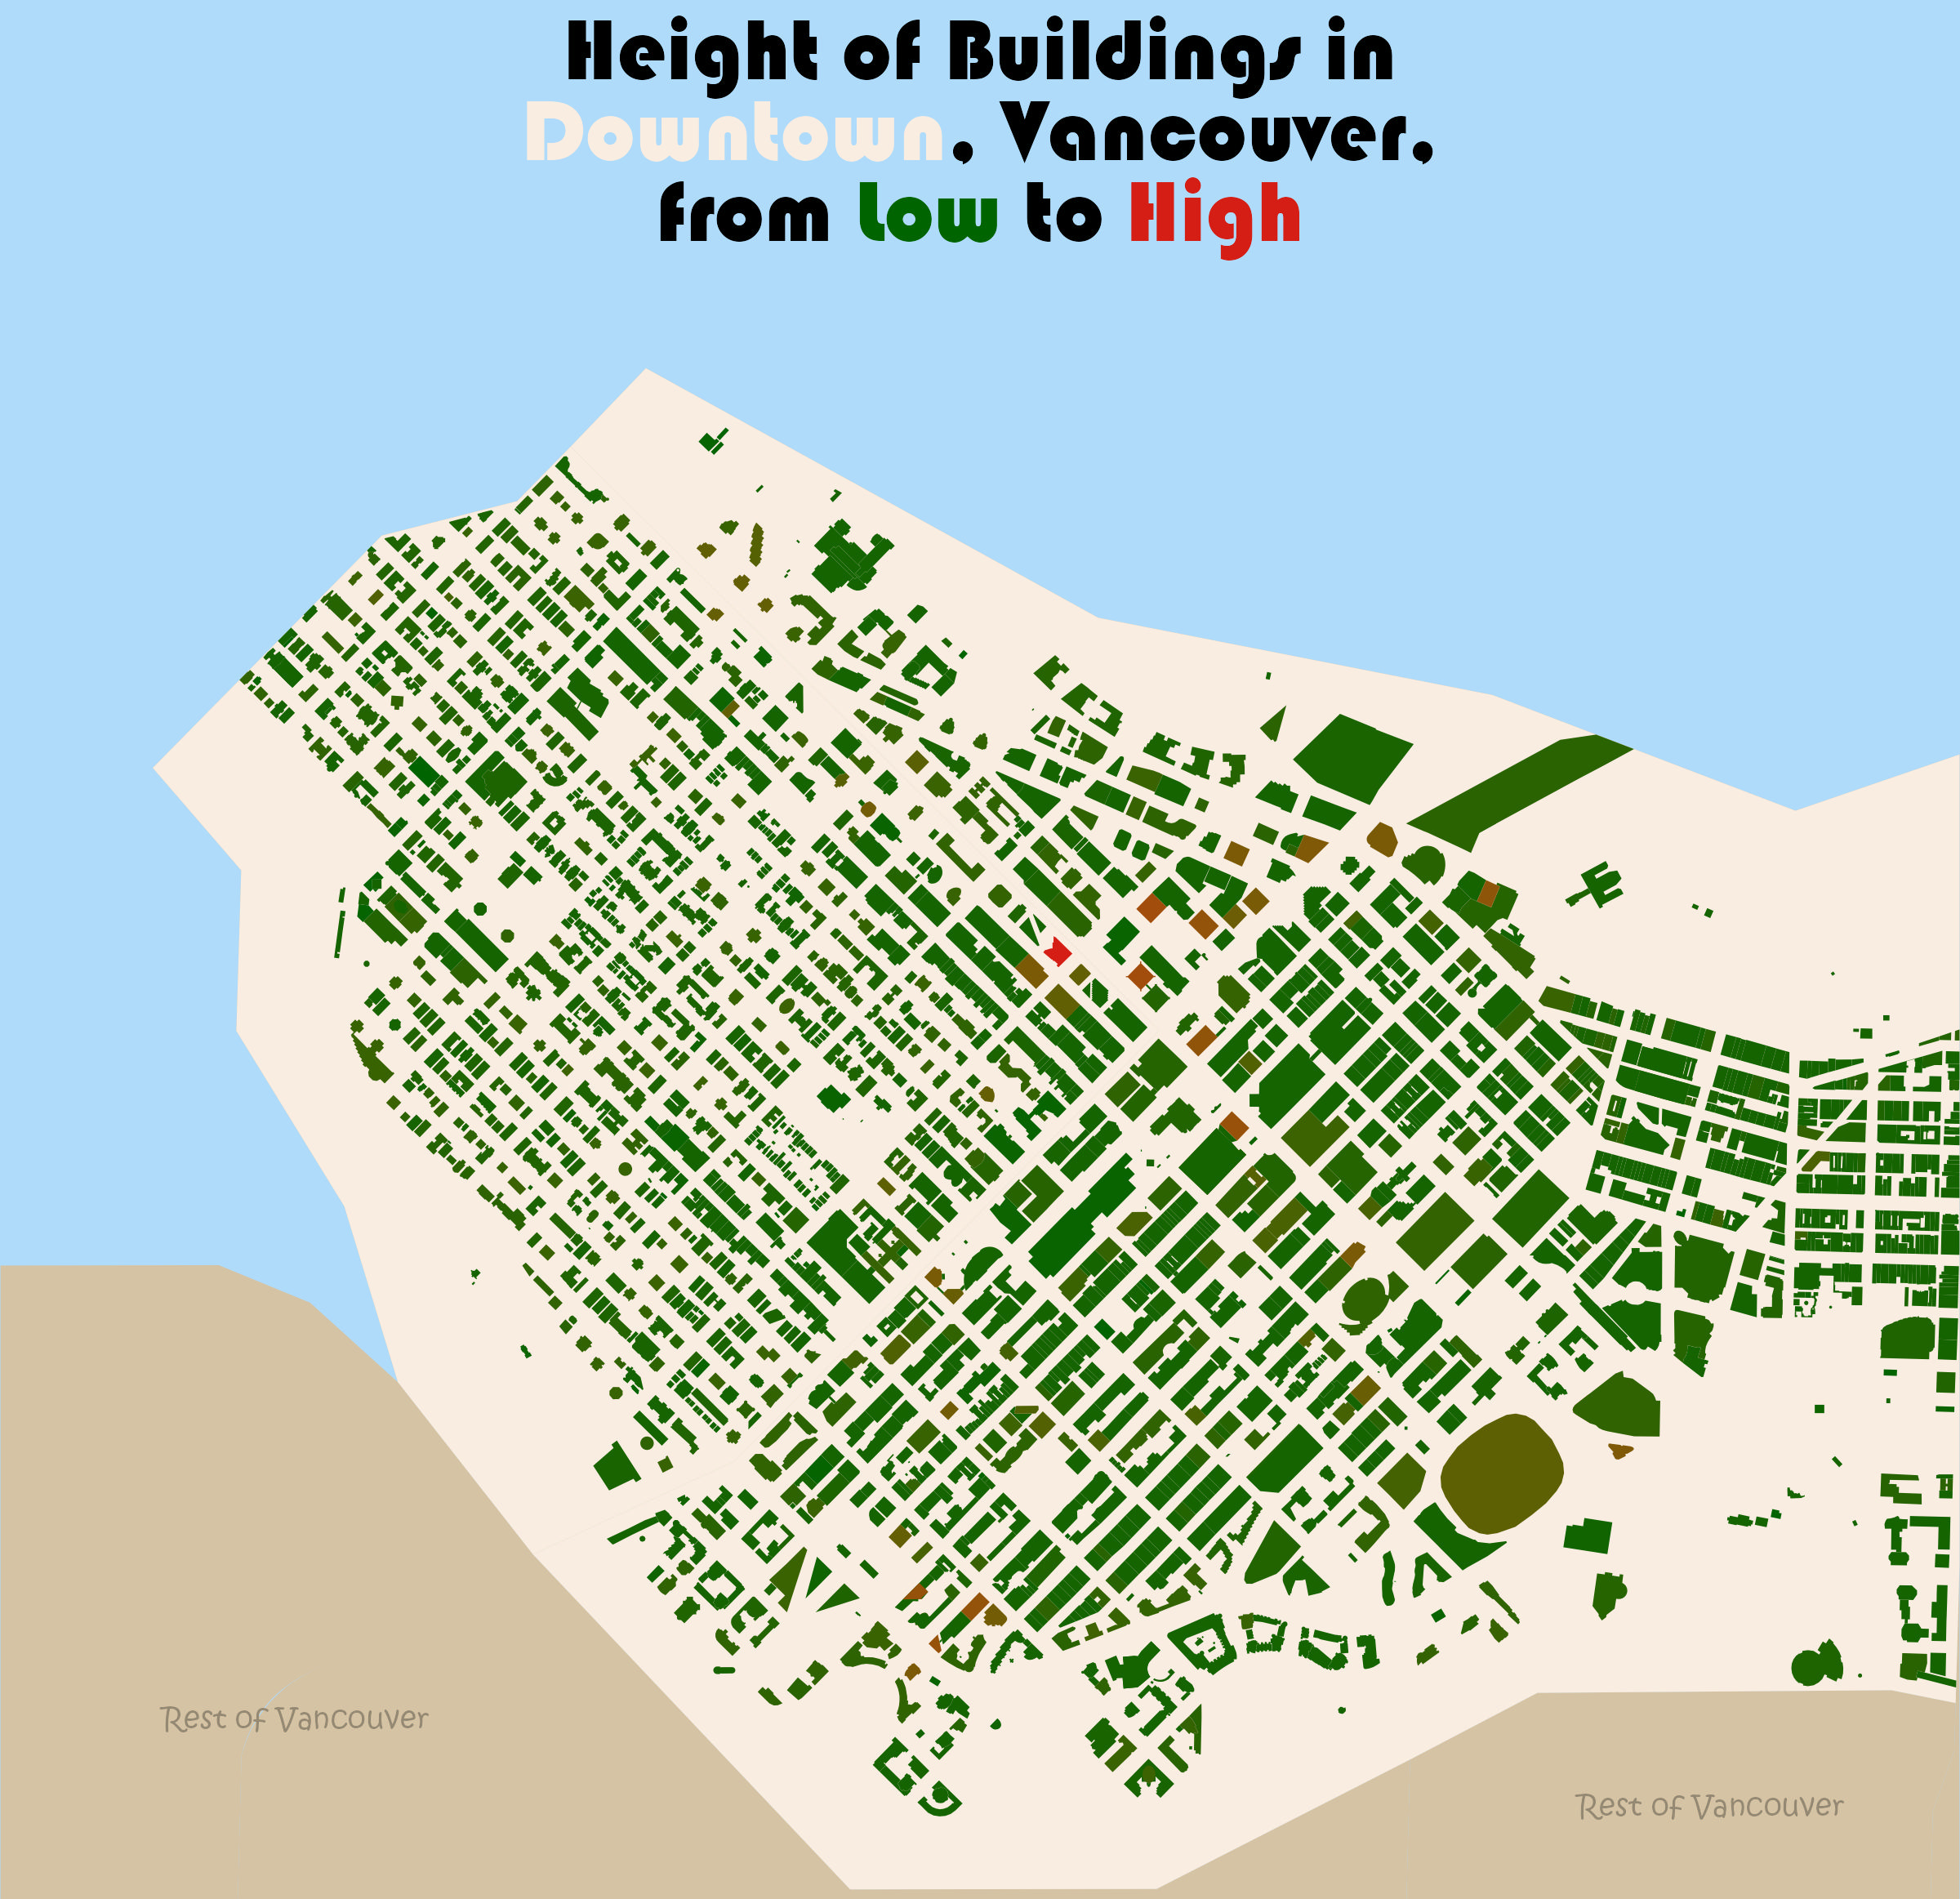
Overture is another new tool I learned to use, and it provides many interesting data including the height of buildings, which is plotted here in this map. While the data was hard to download, it was interesting to see that I was able to test with the 3d elements of this data. While the 3d elements aren’t shown here in this map, it is very interesting to try and see the way that buildings are in Downtown Vancouver, despite it not being the most accurate. Other aesthetic choices include the choice of coloring the land differently, showing which areas we are focused on and which belong to the rest of Vancouver, and the use of blue is to obviously show the presence of water, making this feel more like a normal map with land and water alike.