Created by Zhanchao Yang
Source ↗
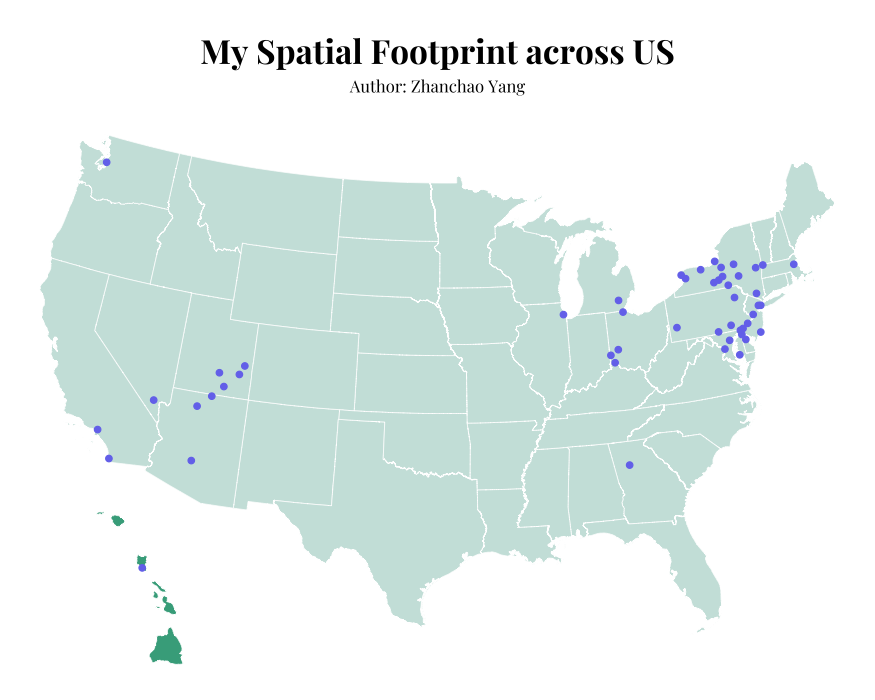
Day 4 (My Data): I created a map visualizing my spatial footprint across the United States using R. This map displays locations I’ve visited throughout the country, with points represented to their geographic positions. The visualization employs a two-panel approach, featuring a main map of the continental US and an inset map of Hawaii, which provides comprehensive geographic coverage of my travels.
The map utilizes custom coordinate reference systems (CRS 5070 for the mainland and CRS 6633 for Hawaii) to ensure accurate spatial representation. It employs elegant typography with the Playfair Display font for a polished aesthetic. The data was manually created using geojson.io.
Technical Implementation:
- sf (Simple Features) - R package for handling spatial vector data and geometric operations
- ggplot2 - R’s powerful data visualization package, extended with
geom_sf()for mapping - cowplot - R package for combining plots and creating complex layouts with insets
- dplyr - R package for data manipulation and transformation
- sysfonts & showtext - R packages for custom font integration and rendering
Data Sources:
- Personal Location Data: Custom dataset created using geojson.io - an open-source tool for creating, editing, and sharing GeoJSON data
- State Boundaries: U.S. Census Bureau Cartographic Boundary Files - 2024 State Boundaries (5m resolution)