Created by Zhanchao Yang
Source ↗
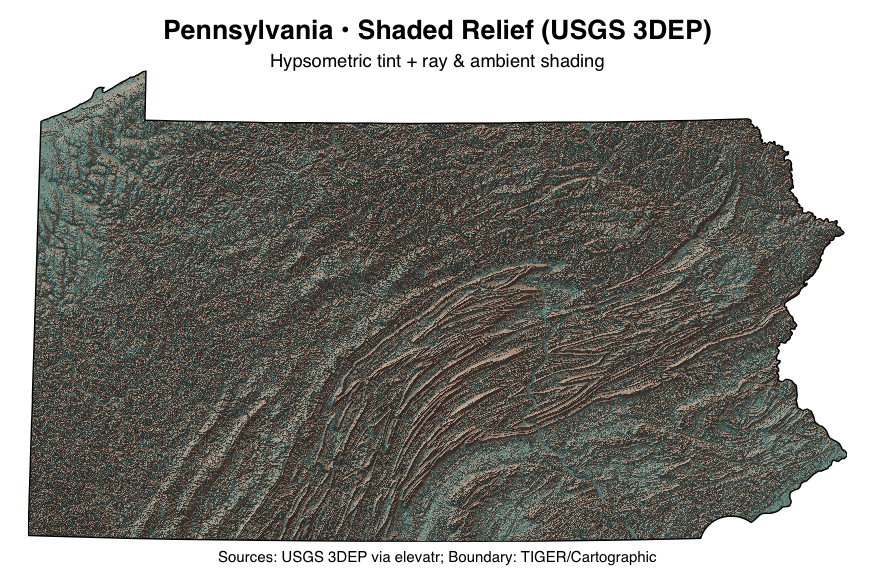
Day 5 (Earth): I created a shaded relief map of Pennsylvania using digital elevation data, which showcases the state’s diverse topography from the Appalachian Mountains to the lower-lying regions. This visualization combines hypsometric tinting with advanced ray-tracing and ambient shading techniques through the rayshader package. It creates a three-dimensional appearance that emphasizes Pennsylvania’s terrain and elevation changes.
Technical Implementation:
- elevatr - R package for accessing elevation data from the USGS 3D Elevation Program (3DEP)
- rayshader - R package for creating advanced 2D and 3D data visualizations with ray-tracing and ambient occlusion
- terra - R package for spatial data analysis and raster processing
- sf - R package for handling spatial vector data and geometric operations
- tigris - R package for accessing TIGER/Line shapefiles from the U.S. Census Bureau
- ggplot2 - R’s powerful data visualization package.
- viridis - R package providing perceptually uniform color scales
- dplyr - R package for data manipulation and transformation
Data Sources:
- Elevation Data: USGS 3D Elevation Program (3DEP) - High-resolution digital elevation model accessed via
elevatrpackage at zoom level 10 - State Boundaries: U.S. Census Bureau TIGER/Line Cartographic Boundary Files - 2023 State Boundaries
Coordinate Reference System:
EPSG:2272(Pennsylvania State Plane South, NAD83, US Feet) for accurate local representation