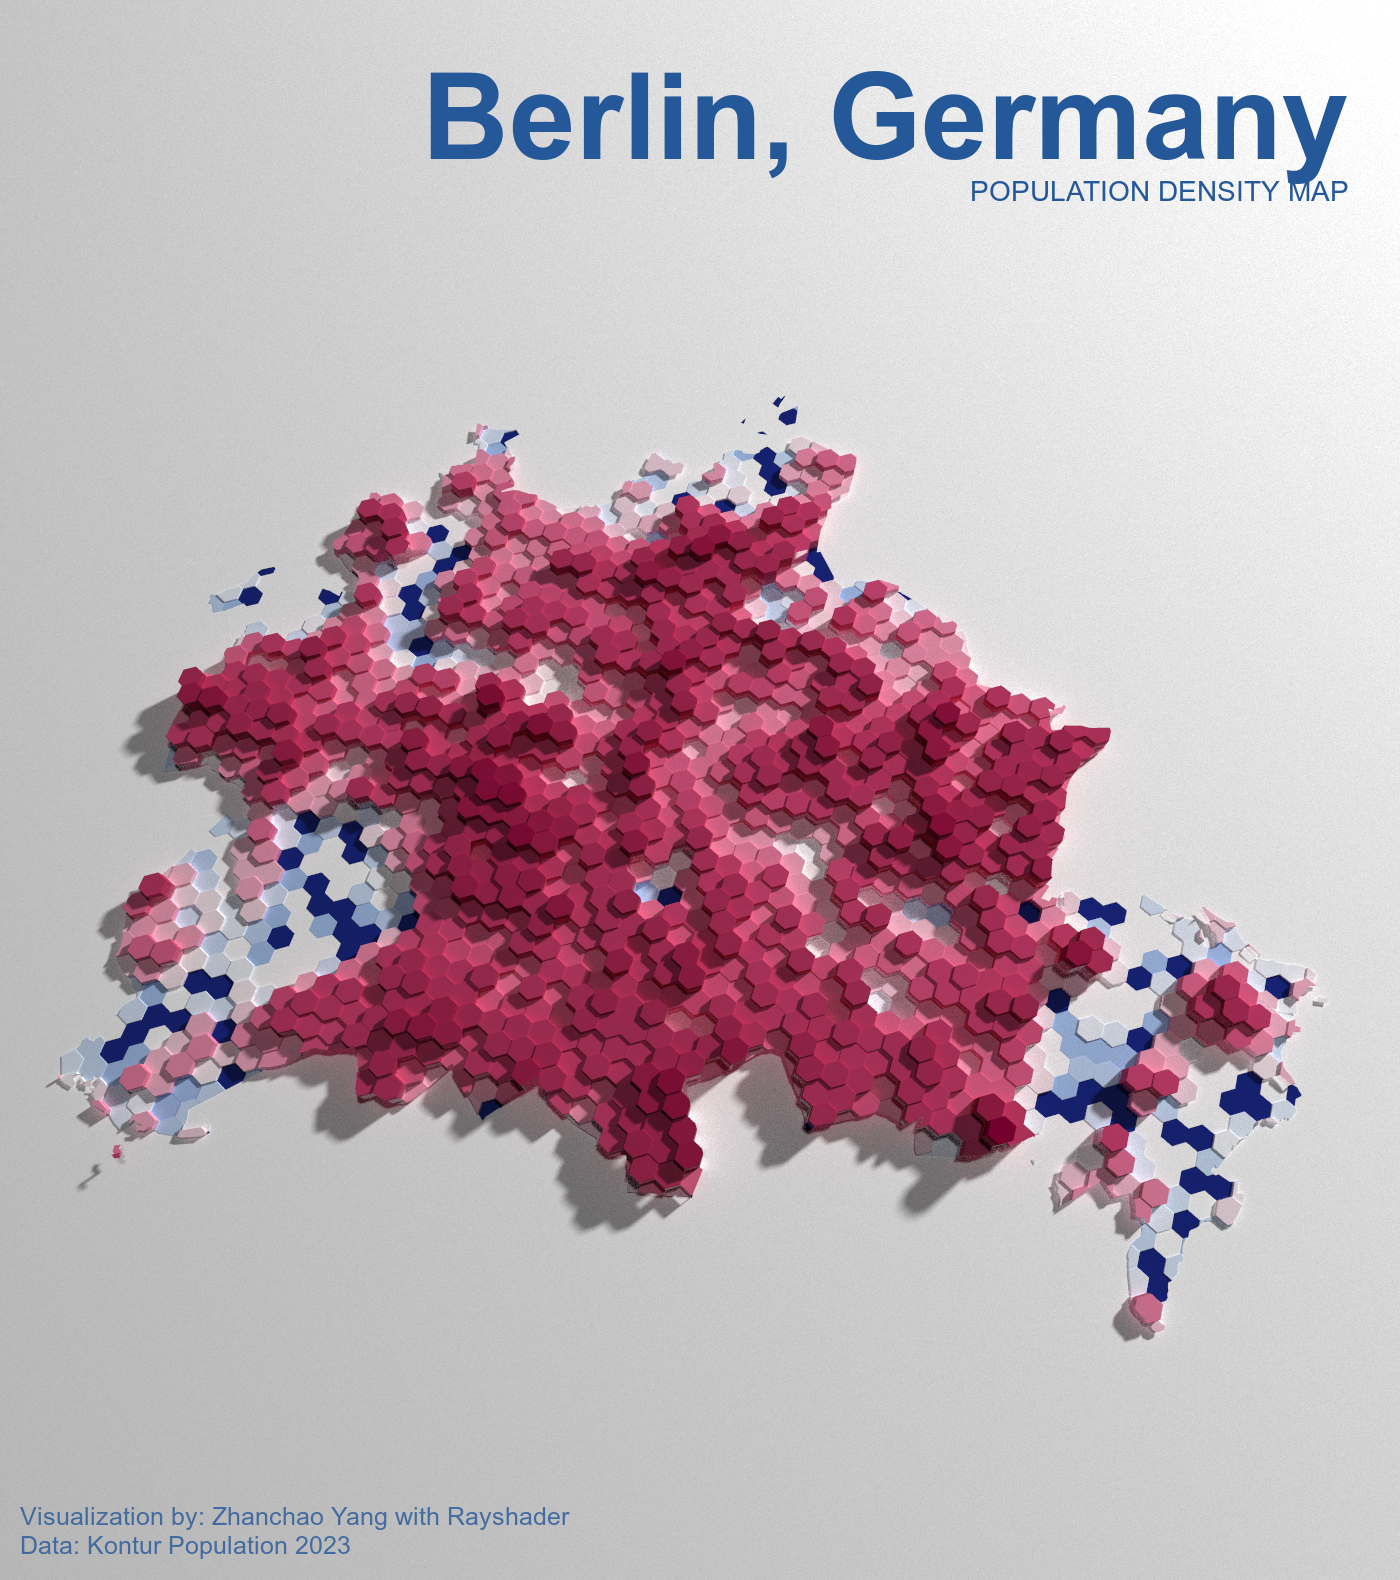
Day 6 (Dimensions): I created a 3D population density map of Berlin, Germany using R and the rayshader package. This visualization goes beyond traditional 2D mapping by adding a third dimension - height - to represent population density. The map uses hexagonal grid cells from the Kontur Population dataset, where the height of each cell corresponds to its population density, creating a striking 3D landscape that reveals Berlin’s demographic patterns.
The visualization employs advanced ray-tracing techniques to render realistic lighting and shadows, giving depth and dimension to the population data. The color scheme uses the Benedictus palette from MetBrewer, creating an elegant gradient that enhances the three-dimensional effect.
Acknowledgement:
Special thanks for the tutorial made possible by Niloy Biswas.
Technical Implementation:
- sf - R package for handling spatial vector data and geometric operations
- stars - R package for spatiotemporal arrays, used for rasterizing the population data
- rayshader - R package for creating advanced 2D and 3D data visualizations with ray-tracing and ambient occlusion
- tmap - R package for thematic mapping and spatial data visualization
- ggplot2 - R’s powerful data visualization package
- MetBrewer - R package providing color palettes inspired by works at the Metropolitan Museum of Art
- magick - R package for image processing and annotation
- showtext & sysfonts - R packages for custom font integration and rendering
- colorspace - R package for color manipulation and darken/lighten operations
Data Sources:
- Population Data: Kontur Population Dataset 2023 - High-resolution population density data for Germany in hexagonal grid format
- Administrative Boundaries: Administrative boundary data for Berlin, Germany