Created by Jingqi Lu
Source ↗
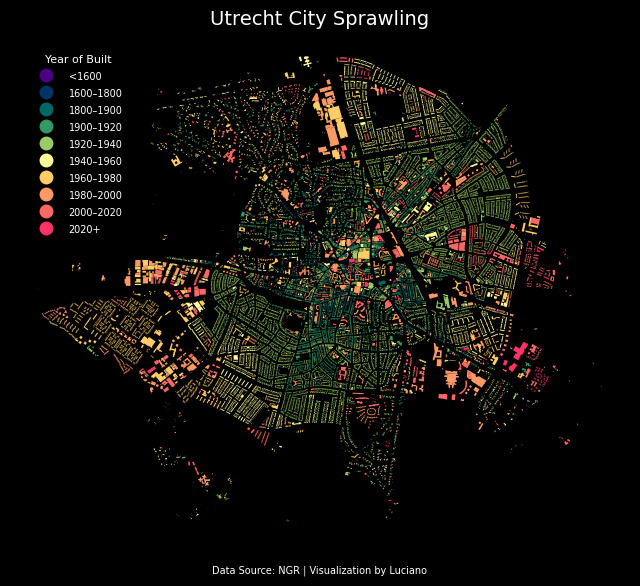
This map illustrates the temporal layering of Utrecht’s built environment, where each color represents a period of construction — from medieval cores to 21st-century developments.Older neighborhoods cluster around the historic center, while expansion radiates outward through successive centuries, tracing the city’s evolution and spatial morphology.The visualization uses a dark basemap to highlight the vibrant chronology of urban growth, symbolizing how time and space weave together in the city’s form.