Created by Zhanchao Yang
Source ↗
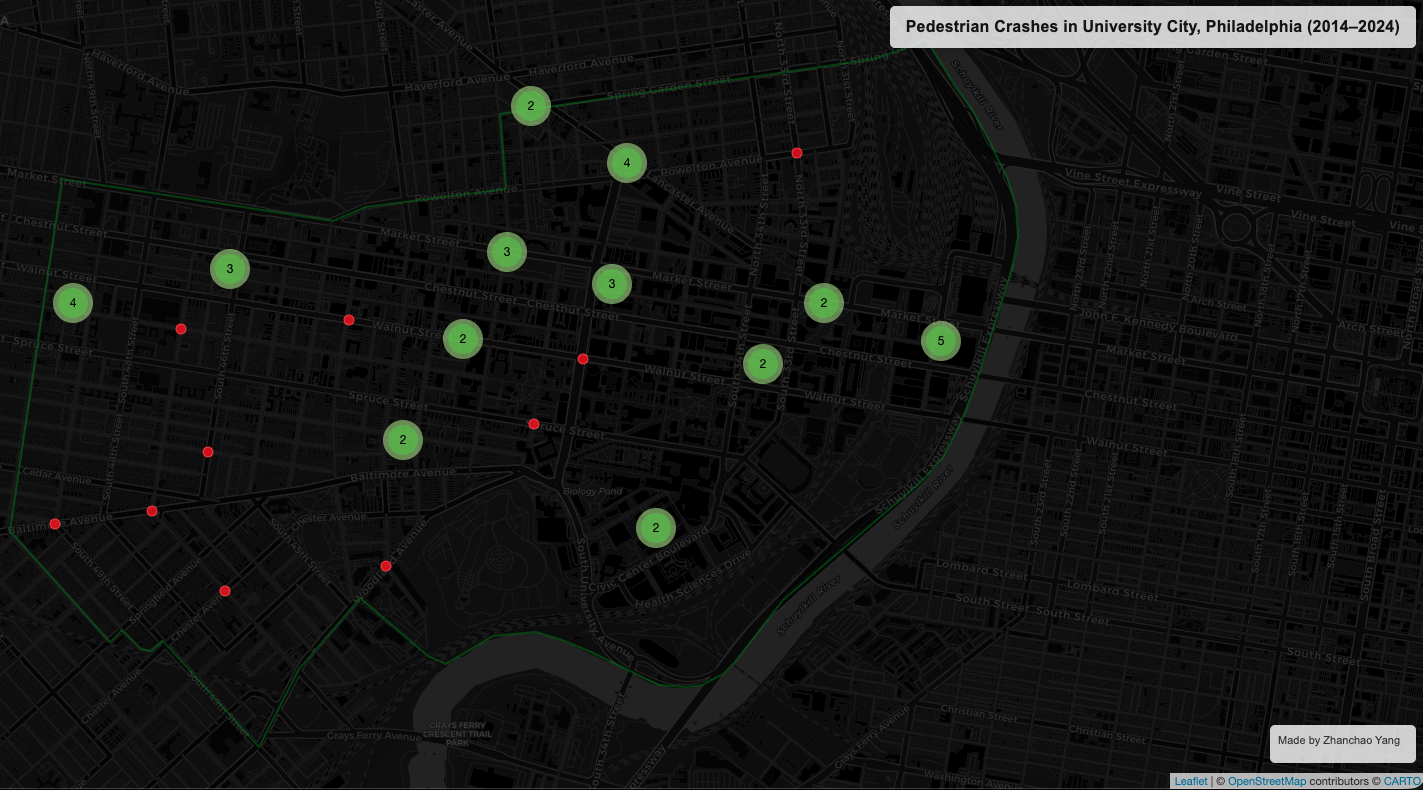
Day 11 (Minimal): I created a minimalist interactive map visualizing pedestrian crashes in University City, Philadelphia, from 2014 to 2024. This visualization embraces the “less is more” philosophy of minimal design by using a dark basemap with simple red circular markers to represent crash locations, creating a stark and impactful visual that immediately draws attention to areas of pedestrian safety concern.
Explore the interactive map through here
Technical Implementation:
- sf - R package for handling spatial vector data and geometric operations
- tidyverse - R’s ecosystem of packages for data manipulation and visualization
- leaflet - R package for creating interactive web maps
- htmltools - R package for generating HTML elements and controls
Data Sources:
- Crash Data: Pedestrian crash data for University City, Philadelphia (2014-2024), only includes pedestrian crashes
- Boundary Data: University City administrative boundary in GeoJSON format