Created by Zhanchao Yang
Source ↗
Day 12 (2125): I created a speculative visualization of Philadelphia in the year 2125, imagining how the city’s relationship with water bodies and green spaces might evolve. This map projects a future where Philadelphia has expanded its water buffers by 100 meters (because of global warming) and parks expanded by 500 meters, a hypothetical scenario of enhanced environmental planning and climate adaptation.
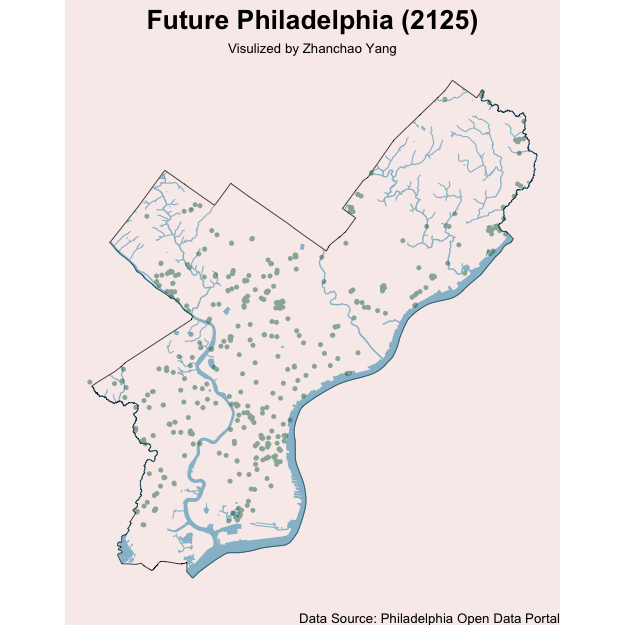
Explore the interactive map through the link here.
Technical Implementation:
- sf - R package for handling spatial vector data and geometric operations
- tidyverse - R’s ecosystem of packages for data manipulation and visualization
- leaflet - R package for creating interactive web maps
- htmltools - R package for HTML generation in R
- ggplot2 - R’s powerful data visualization package (via tidyverse)
Data Sources:
- Philadelphia Boundary: Philadelphia City Limits - City boundary data from Philadelphia Open Data Portal
- Water Bodies: Water Features Dataset - Water body geometries from Philadelphia Open Data Portal
- Parks & Facilities: City Facilities Dataset - Park locations from Philadelphia Open Data Portal