Created by Zhanchao Yang
Source ↗
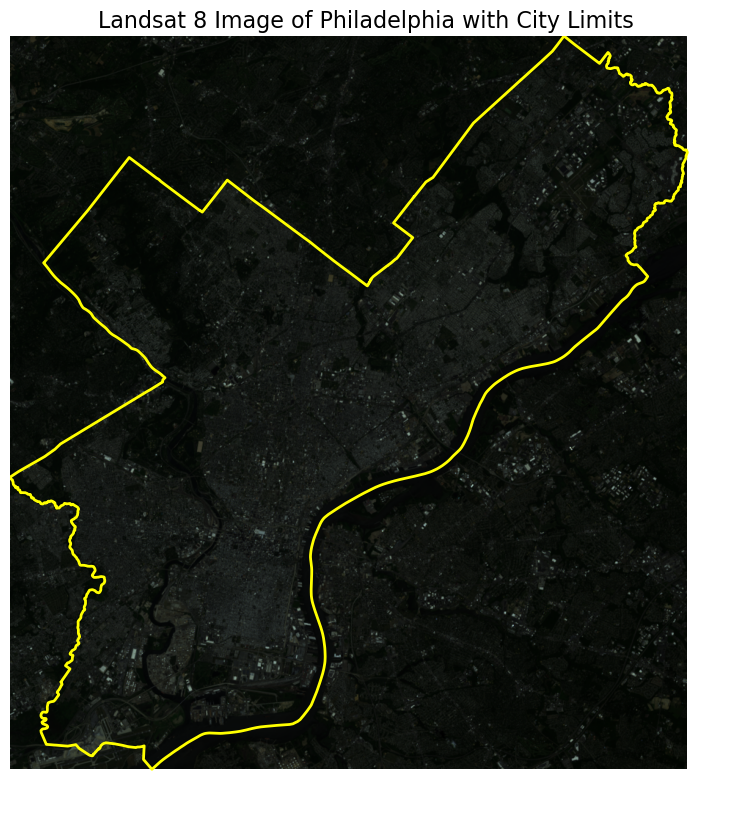
Day 13 (10 minute map): I created a quick visualization of Philadelphia using Landsat 8 satellite imagery, overlaid with the city’s administrative boundaries. This map was designed and produced in under 10 minutes, focusing on speed and simplicity while showcasing Philadelphia’s urban footprint from space. The true-color composite from Landsat 8’s RGB bands reveals the city’s layout, with the Delaware River to the east and Schuylkill River winding through the city, highlighted by the yellow city boundary overlay.
Technical Implementation:
- rasterio - Python library for reading and writing raster datasets
- geopandas - Python library for working with geospatial vector data
- matplotlib - Python’s comprehensive library for creating visualizations
- numpy - Python library for numerical computing and array operations
Data Sources:
- Landsat 8 Imagery: Landsat 8 satellite imagery of Philadelphia (RGB bands 2, 3, 4 for true-color composite)
- Philadelphia City Limits: Philadelphia City Limits - City boundary data from Philadelphia Open Data Portal