Created by Zhanchao Yang
Source ↗
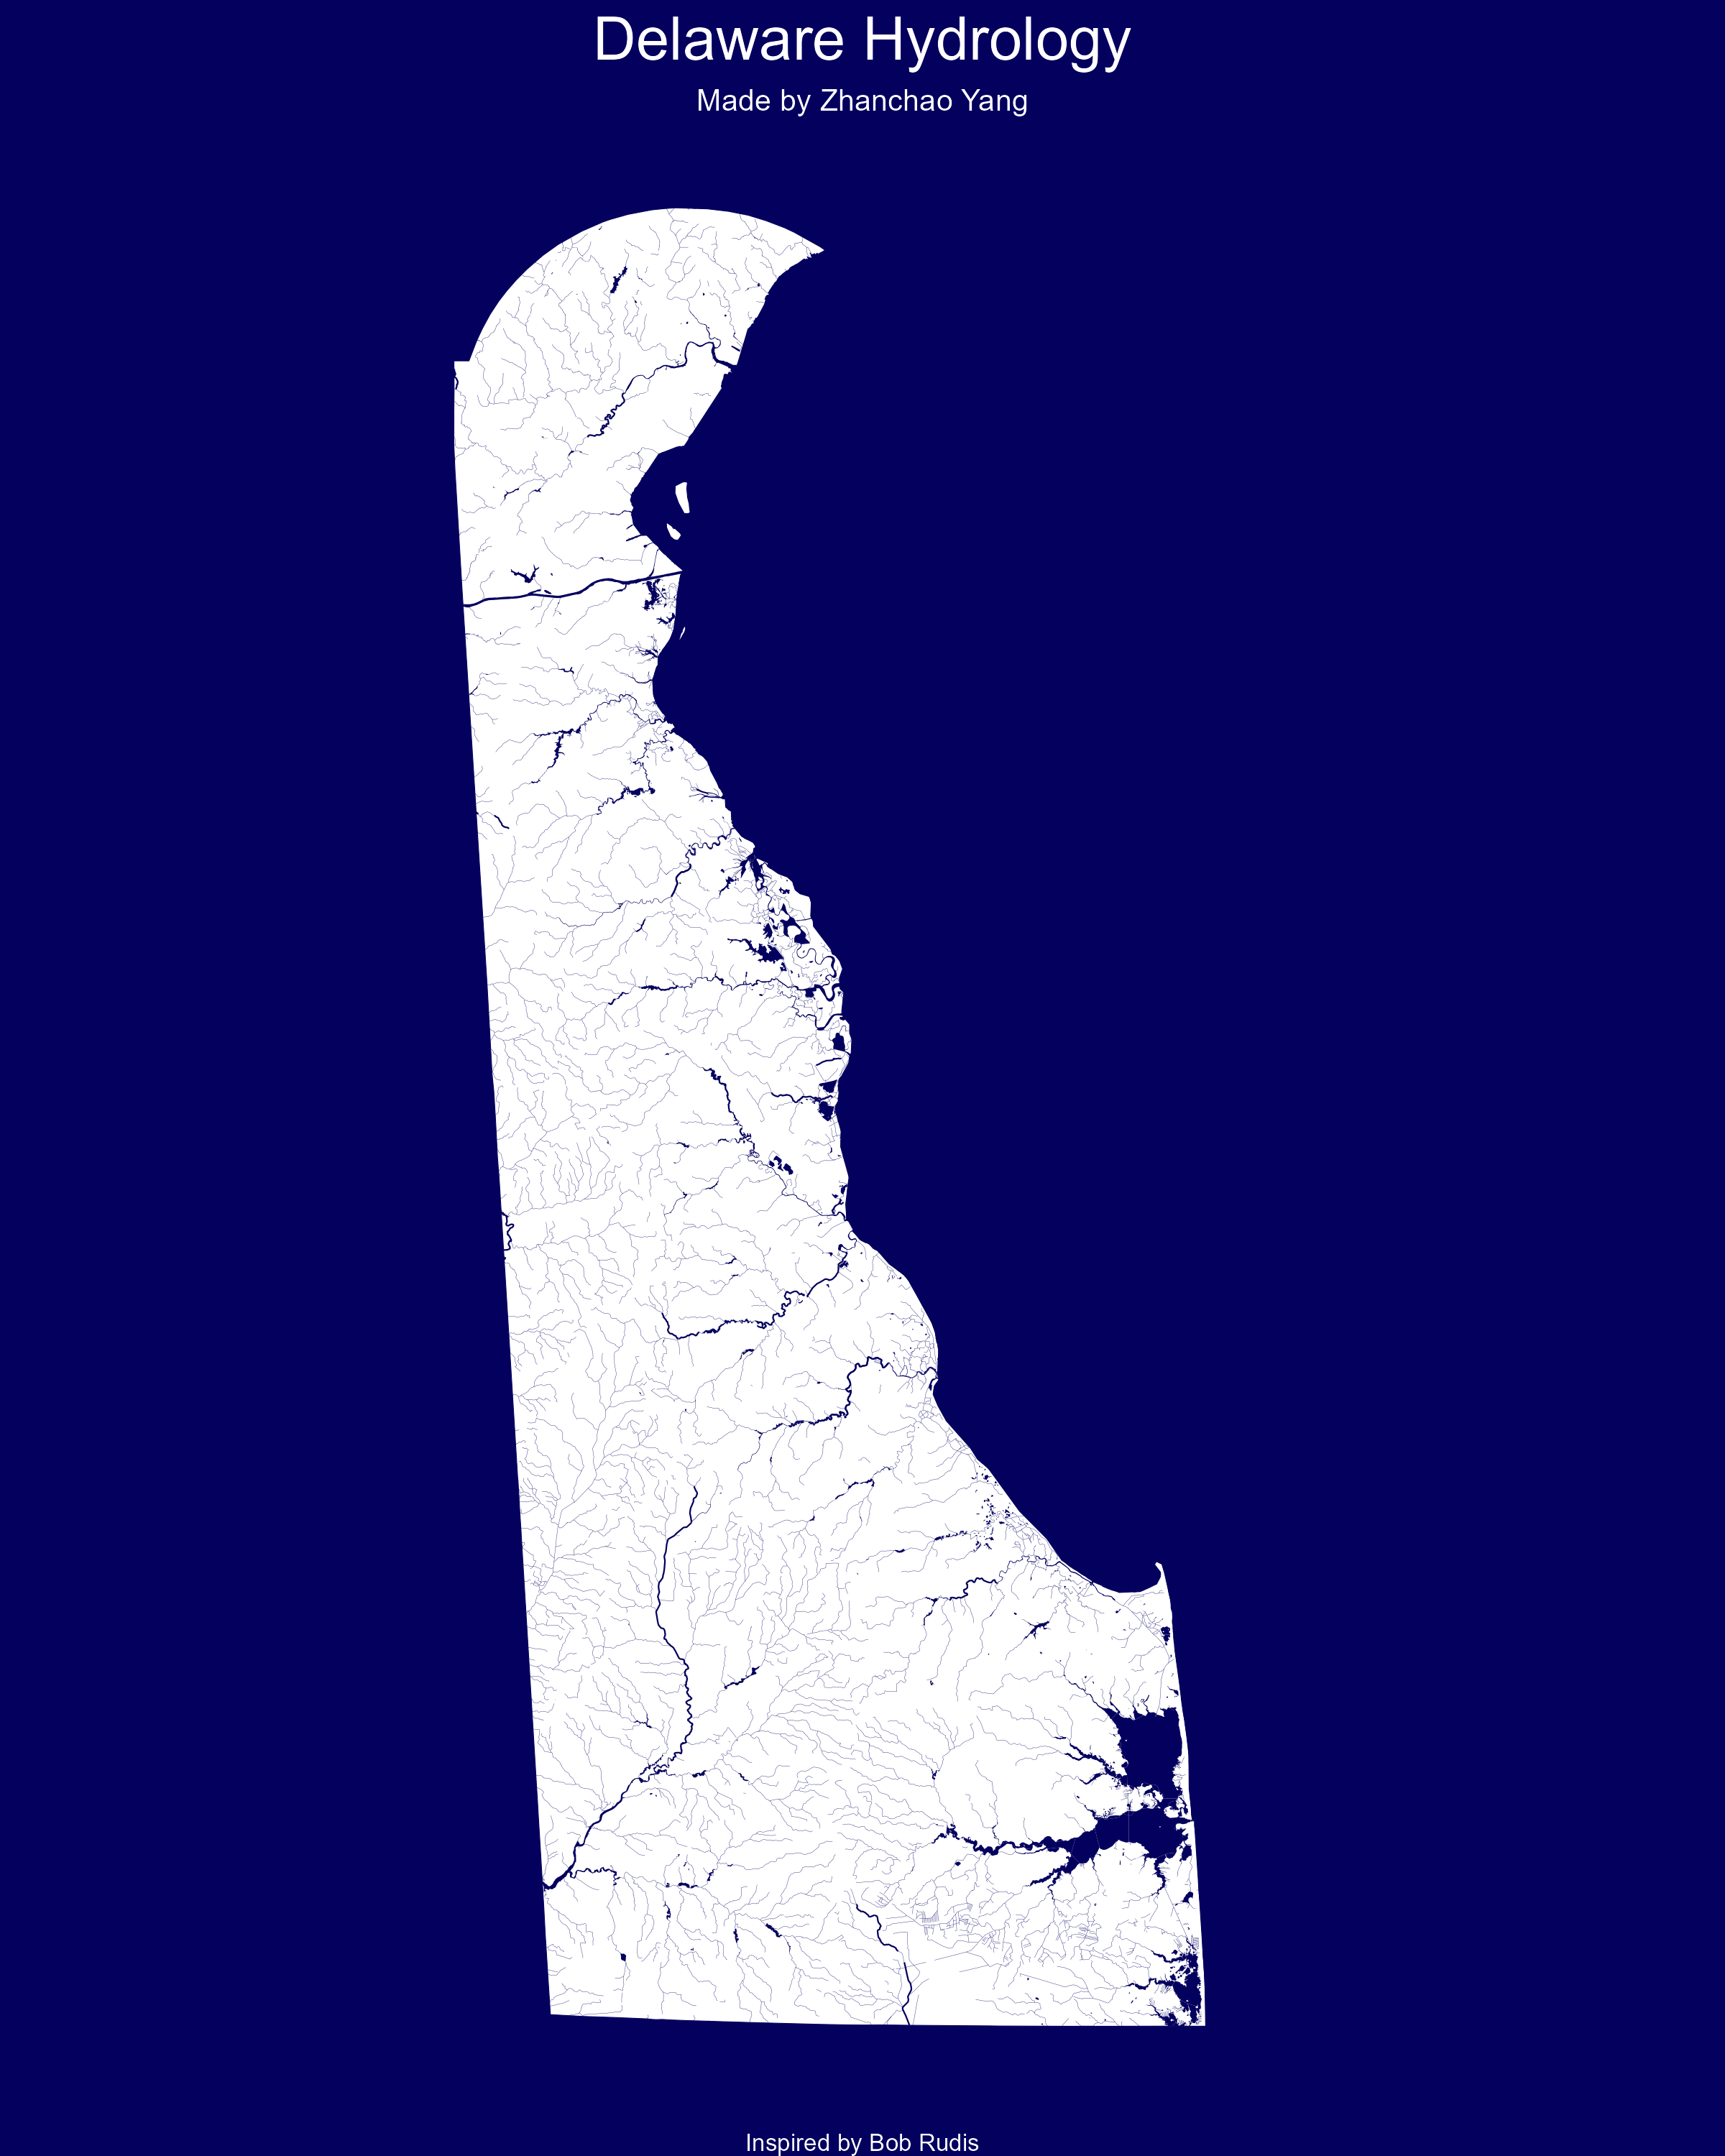
Day 20 (Water): I created a visualization of Delaware’s hydrology, showcasing the intricate network of water bodies and river systems throughout the state. This map uses data from the US Census Bureau’s TIGER/Line shapefiles to visualize both area water features (lakes, ponds, reservoirs) and linear water features (rivers, streams, creeks) in Delaware. The visualization employs a dark navy blue color scheme (#04005e) against a white base, creating a striking contrast that emphasizes the water features across all three Delaware counties.
Acknowledgement:
This visualization was inspired by Bob Rudis’ excellent work on hydrology mapping: https://rud.is/books/30-day-map-challenge/hydrology-01.html.
Technical Implementation:
- sf (Simple Features) - R package for handling spatial vector data and geometric operations
- tigris - R package for downloading TIGER/Line shapefiles from the US Census Bureau, providing access to geographic boundaries and hydrographic features
- tidyverse - R’s ecosystem of packages for data manipulation and visualization, including ggplot2 and purrr for functional programming
- ggplot2 - R’s powerful data visualization package (via tidyverse) for creating the map visualization
Data Sources:
- County Boundaries: US Census Bureau TIGER/Line Shapefiles via the tigris package - Delaware counties (New Castle, Kent, Sussex)
- Area Water Features: US Census Bureau TIGER/Line Area Hydrography Shapefiles - Lakes, ponds, and reservoirs in Delaware counties