Created by Zhanchao Yang
Source ↗
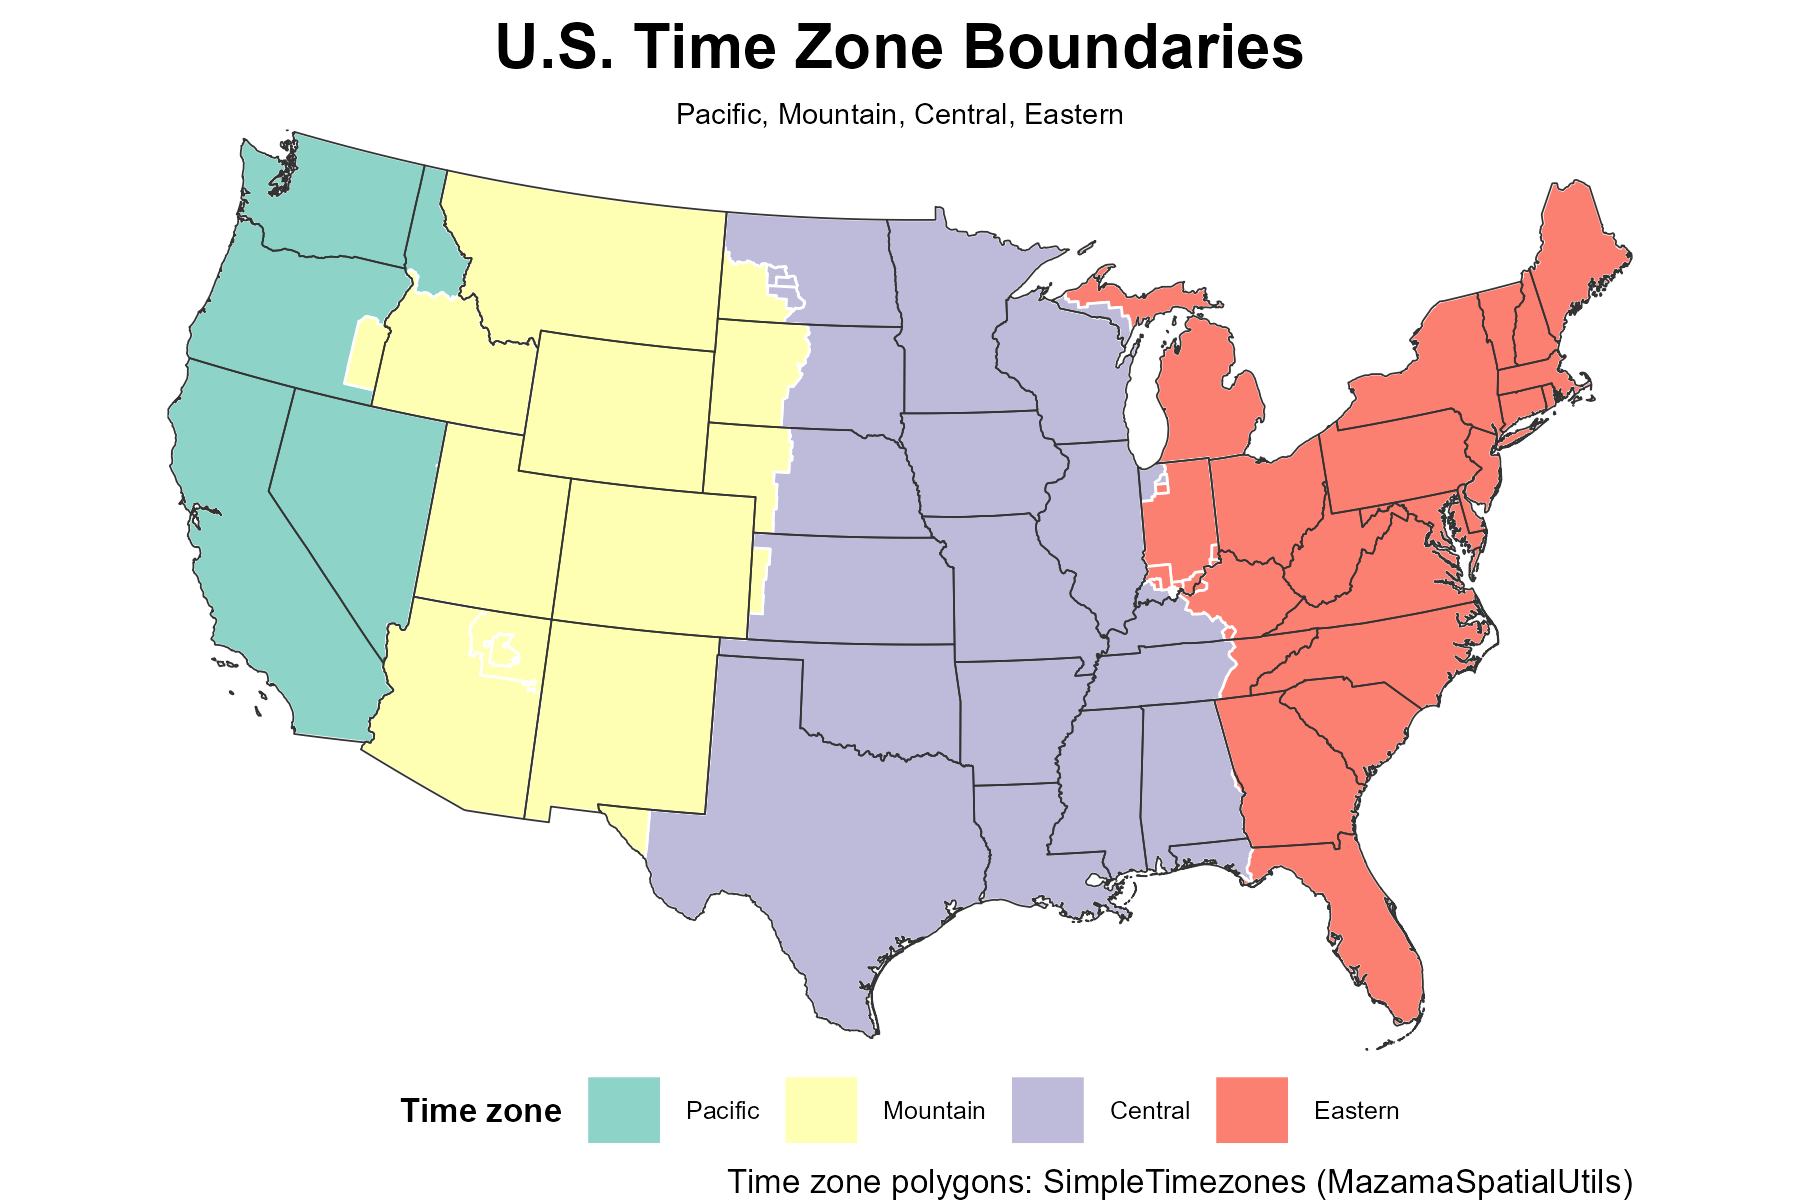
Day 27 (Boundaries): I created a thematic map visualizing U.S. Time Zone Boundaries across the continental United States. This visualization highlights the four major time zones—Pacific, Mountain, Central, and Eastern—using distinct colors from the Set3 color palette, with state boundaries overlaid for geographic context. The map collapses detailed Olson time zone designations into these four broad groups, providing a clean representation of how time is organized across the country. The visualization uses an Albers Equal Area projection (EPSG:5070), which preserves area proportions and is ideal for mapping the continental US, ensuring accurate representation of time zone coverage.
Technical Implementation:
- sf (Simple Features) - R package for handling spatial vector data and geometric operations, including coordinate transformations and spatial intersections
- dplyr - R package for data manipulation, used for filtering, mutating, and case-based time zone grouping
- ggplot2 - R’s powerful data visualization package for creating the layered map visualization with custom color scales and themes
- MazamaSpatialUtils - R package providing access to built-in world time zone polygon data through the SimpleTimezones dataset
- rnaturalearth - R package for accessing Natural Earth vector map data, used for retrieving US state boundaries
Data Sources:
- Time Zone Polygons: MazamaSpatialUtils SimpleTimezones Dataset - Built-in world time zone polygons filtered to United States boundaries and collapsed into four major time zones
- State Boundaries: Natural Earth Data - US state boundaries accessed via the rnaturalearth package for overlay visualization