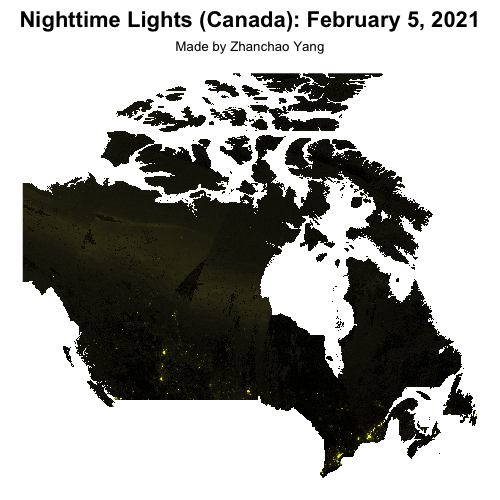
Day 28 (Black): I created a nighttime lights visualization of Canada using NASA’s Black Marble VIIRS/Suomi NPP data. This visualization captures the luminous footprint of human activity across the country on February 5, 2021, with the black background emphasizing the stark contrast between illuminated urban areas and the vast dark expanses of the Canadian wilderness. The color gradient transitions from black in unlit regions through yellow for moderate light intensity to red for the brightest urban centers, with a logarithmic transformation applied to handle the skewed distribution of nighttime radiance values. Major population centers along the US-Canada border—including Toronto, Montreal, Vancouver, and Calgary—stand out prominently against the predominantly dark northern territories. At the same time, I learned about a new package called blackmarbler.
Technical Implementation:
- blackmarbler - R package for downloading and processing NASA’s Black Marble nighttime lights data products (VIIRS/Suomi NPP), providing access to high-quality nighttime radiance imagery
- sf (Simple Features) - R package for handling spatial vector data and geometric operations, used for managing the region of interest boundary
- terra - R package for spatial data analysis with raster data, used for masking and processing the nighttime lights raster
- ggplot2 - R’s powerful data visualization package for creating the map visualization with custom gradient color scales
- tidyterra - R package that bridges terra raster objects with ggplot2, enabling the use of
geom_spatraster()for raster visualization - geodata - R package for downloading geographic data, used to obtain Canada’s administrative boundary from GADM
Data Sources:
- Nighttime Lights: NASA Black Marble VNP46A2 - VIIRS/Suomi NPP daily nighttime lights data product providing gap-filled, cloud-free radiance composites at 500m resolution
- Country Boundary: GADM Database of Global Administrative Areas - Canada national boundary (level 0) accessed via the geodata package