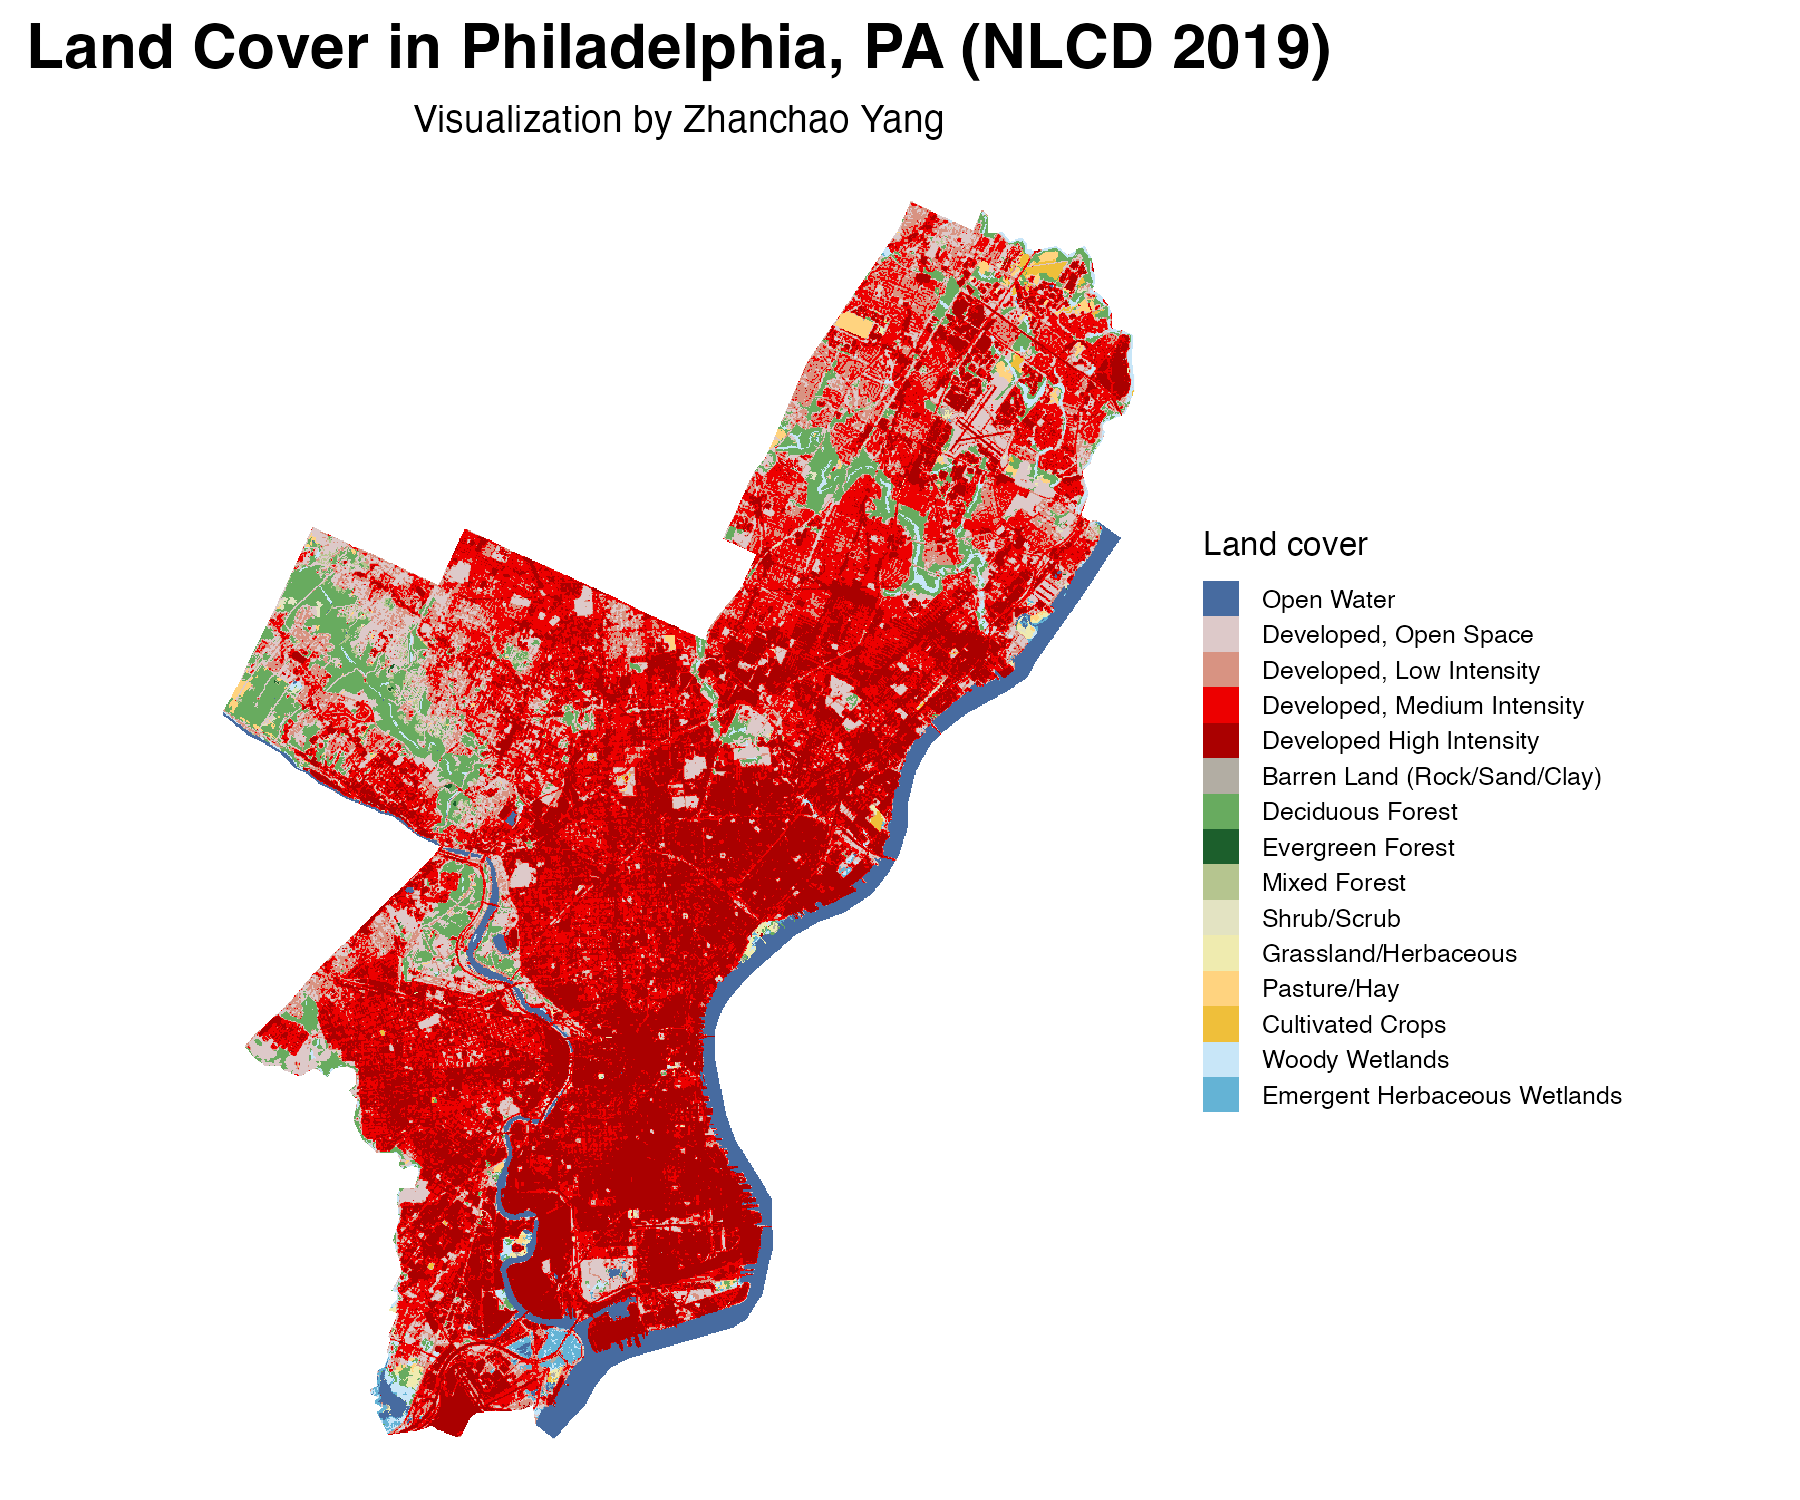
Day 29 (Raster): I created a land cover visualization of Philadelphia, Pennsylvania, using the National Land Cover Database (NLCD) 2019 data. This raster map showcases the diverse land cover types within the city boundaries, highlighting the urban fabric through different development intensities—from open space to high-intensity developed areas—along with natural features like forests, wetlands, and water bodies. The color palette follows the standard NLCD classification scheme, making the map immediately recognizable to those familiar with land cover mapping. Philadelphia’s urban character is clearly visible, with developed areas (red tones) dominating the landscape, interspersed with green spaces representing deciduous forests and parks, and the Schuylkill and Delaware Rivers appearing in blue along the city’s edges.
Technical Implementation:
- tigris - R package for downloading TIGER/Line shapefiles from the US Census Bureau, used to obtain Philadelphia’s city boundary from Pennsylvania places
- terra - R package for spatial data analysis with raster data, providing efficient raster manipulation including projection, cropping, and masking operations
- FedData - R package that simplifies access to federated datasets, used to download NLCD land cover data for the specified area of interest
- sf (Simple Features) - R package for handling spatial vector data and geometric operations, including coordinate transformations to the Albers Equal Area projection
- dplyr - R package for data manipulation, used for filtering the city boundary data
- ggplot2 - R’s powerful data visualization package, used with
geom_raster()for creating the land cover map with custom color scales
Data Sources:
- Land Cover Data: USGS National Land Cover Database (NLCD) 2019 - 30-meter resolution land cover classification for the conterminous United States, providing detailed categorization of land use and land cover types
- City Boundary: U.S. Census Bureau TIGER/Line Shapefiles 2023 - Philadelphia city boundary from Pennsylvania places via tigris package