Created by Zhanchao Yang
Source ↗
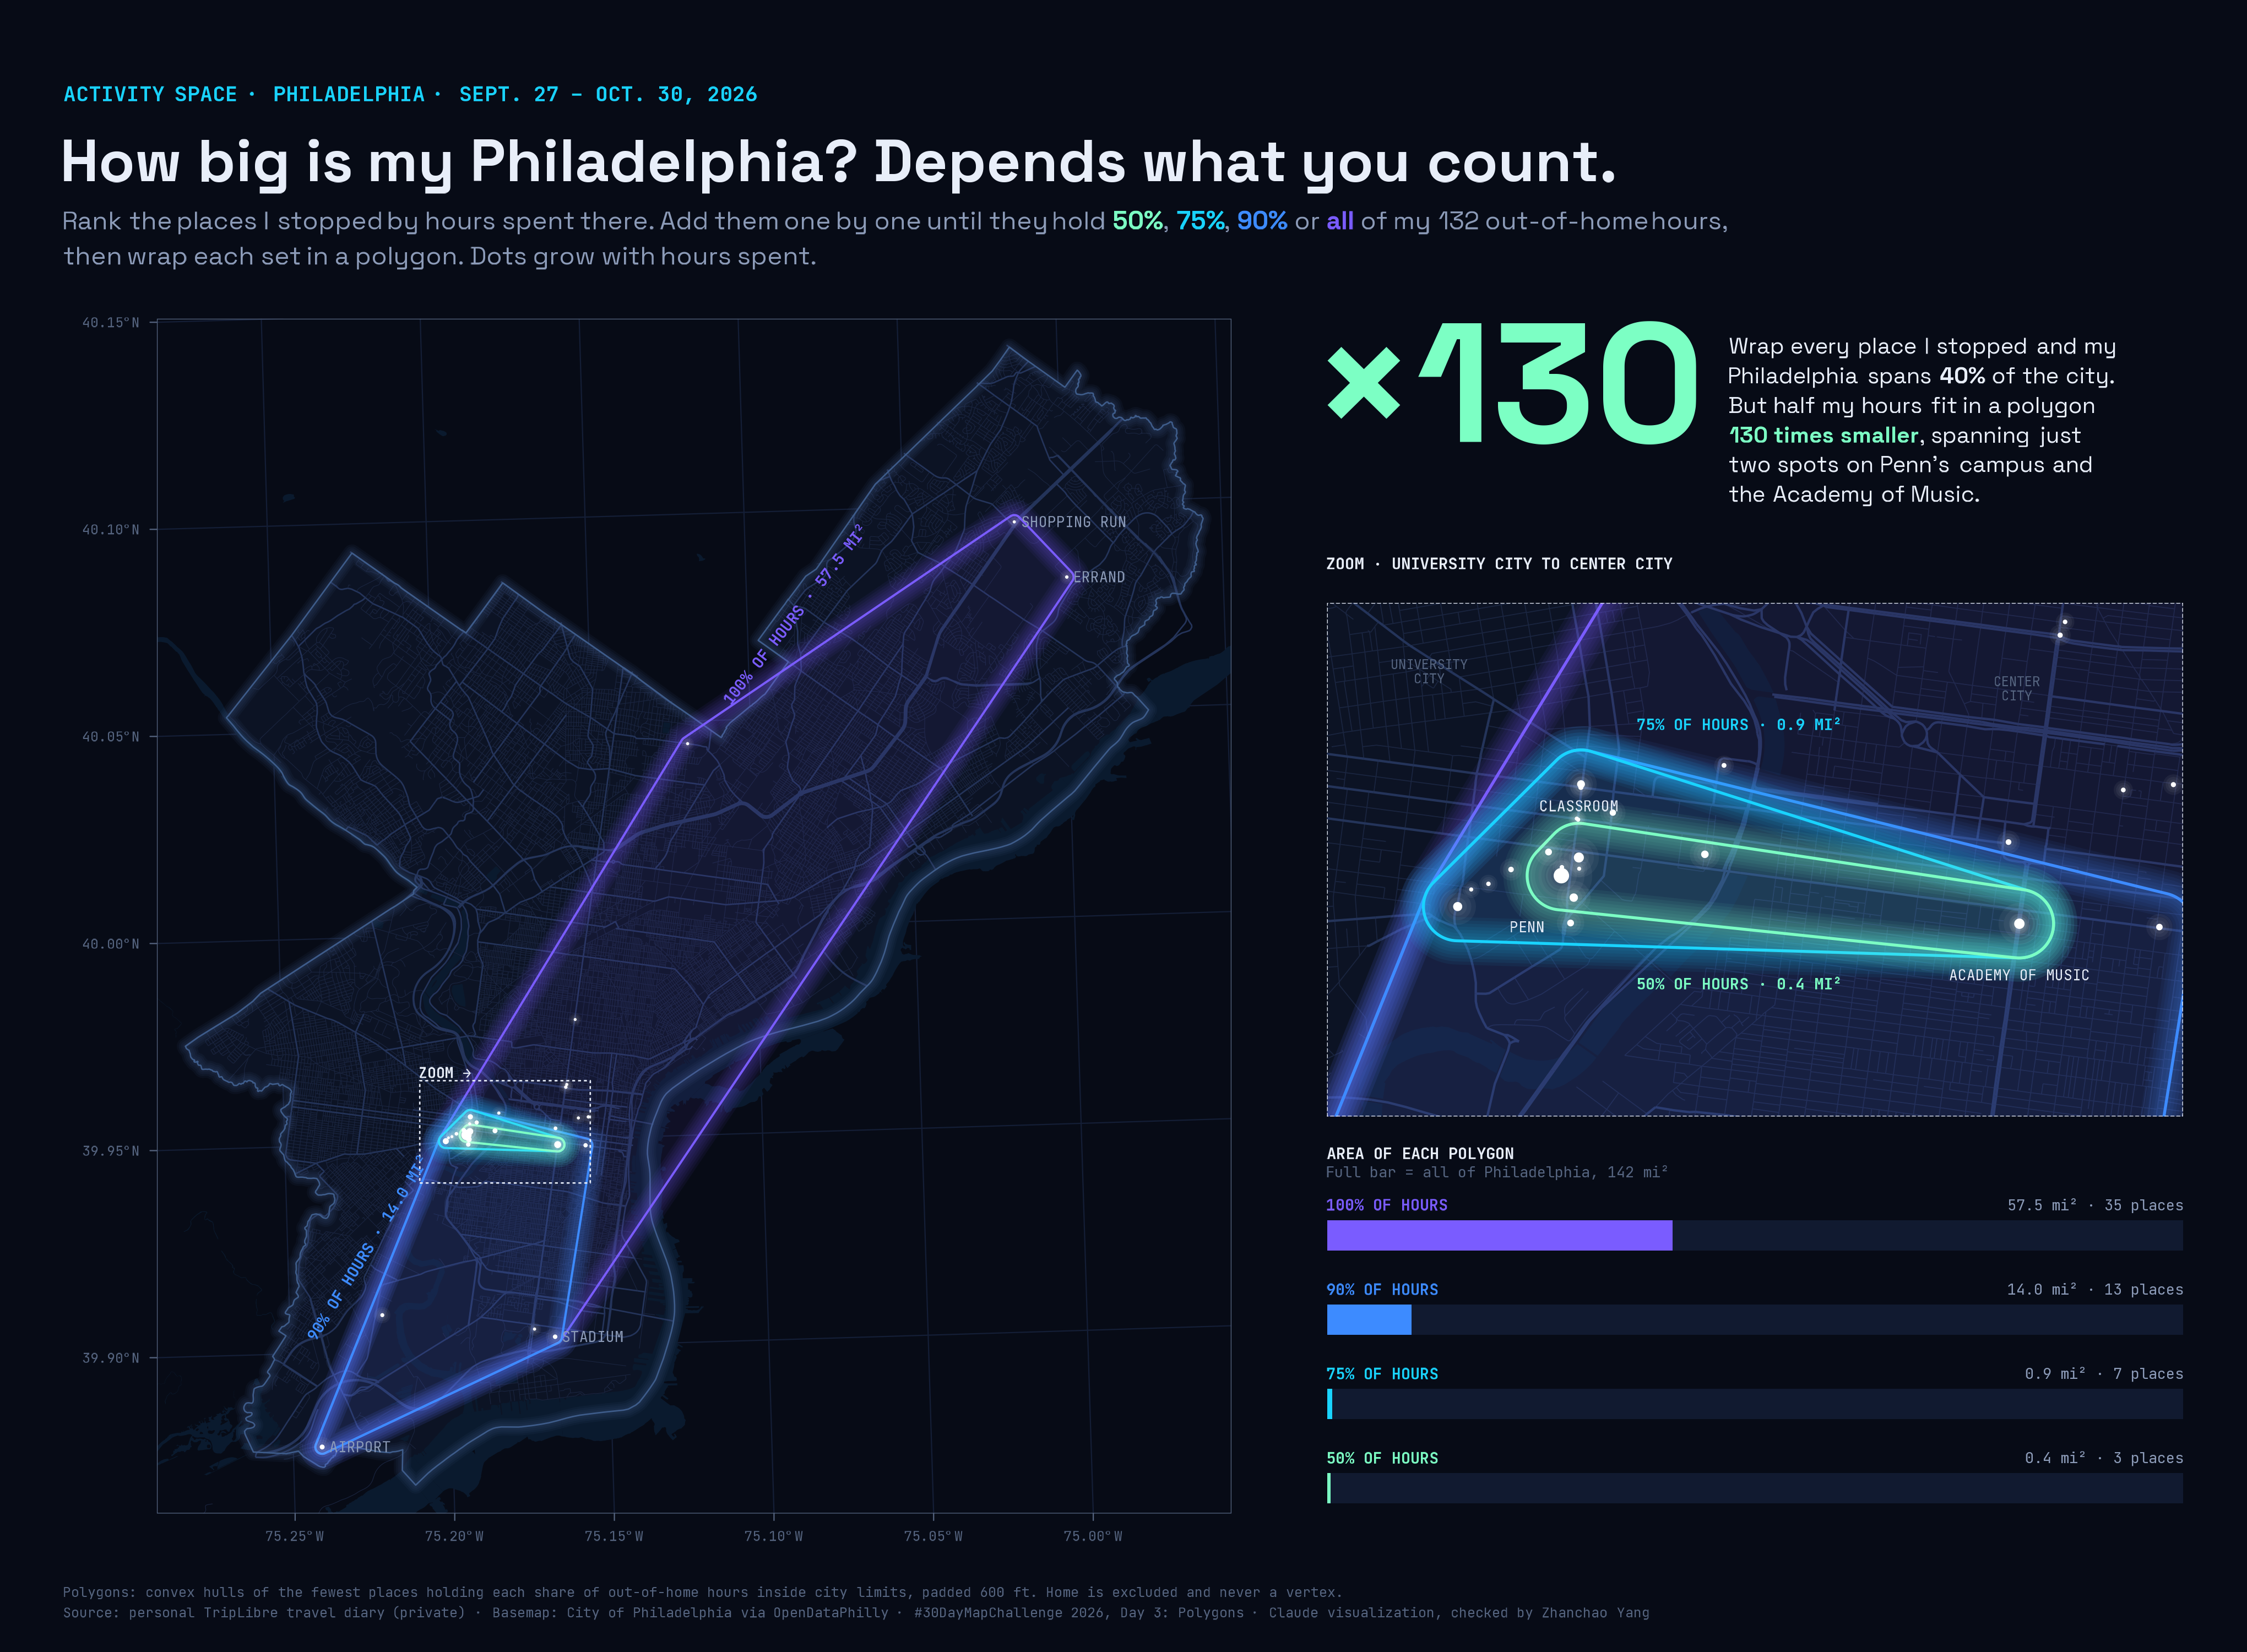
Day 3 (Polygons): Back in Philadelphia with my TripLibre travel diary, I asked how big my activity space is between Sept. 27 and Oct. 30, 2026. I ranked every place I stopped by the hours I spent there, then added places one by one until they held 50%, 75%, 90% or all of my 132 out-of-home hours, and wrapped each set in a polygon. Wrapping every place, my Philadelphia covers 57.5 mi², or 40% of the city. Half my hours fit in a polygon 130 times smaller (0.4 mi²) that spans just two spots on Penn’s campus and the Academy of Music.
Technical Implementation:
- R with
sf,dplyrandggplot2for ranking places by dwell time, building the hulls and mapping patchworkandggtextfor the map, zoom inset and area-bar layout and rich-text annotationsshowtextwith Space Grotesk and JetBrains Mono for typography- Method: each polygon is the convex hull of the fewest places that hold a given share of out-of-home hours inside city limits. Every hull is padded by 600 ft so one- and two-place sets still have an area, and areas are reported for the padded hulls.
- Data: personal TripLibre travel diary export (visits & places). The raw data stays private. Home is excluded and is never a hull vertex.
- Basemap: streets, hydrology and city limits from the City of Philadelphia via OpenDataPhilly