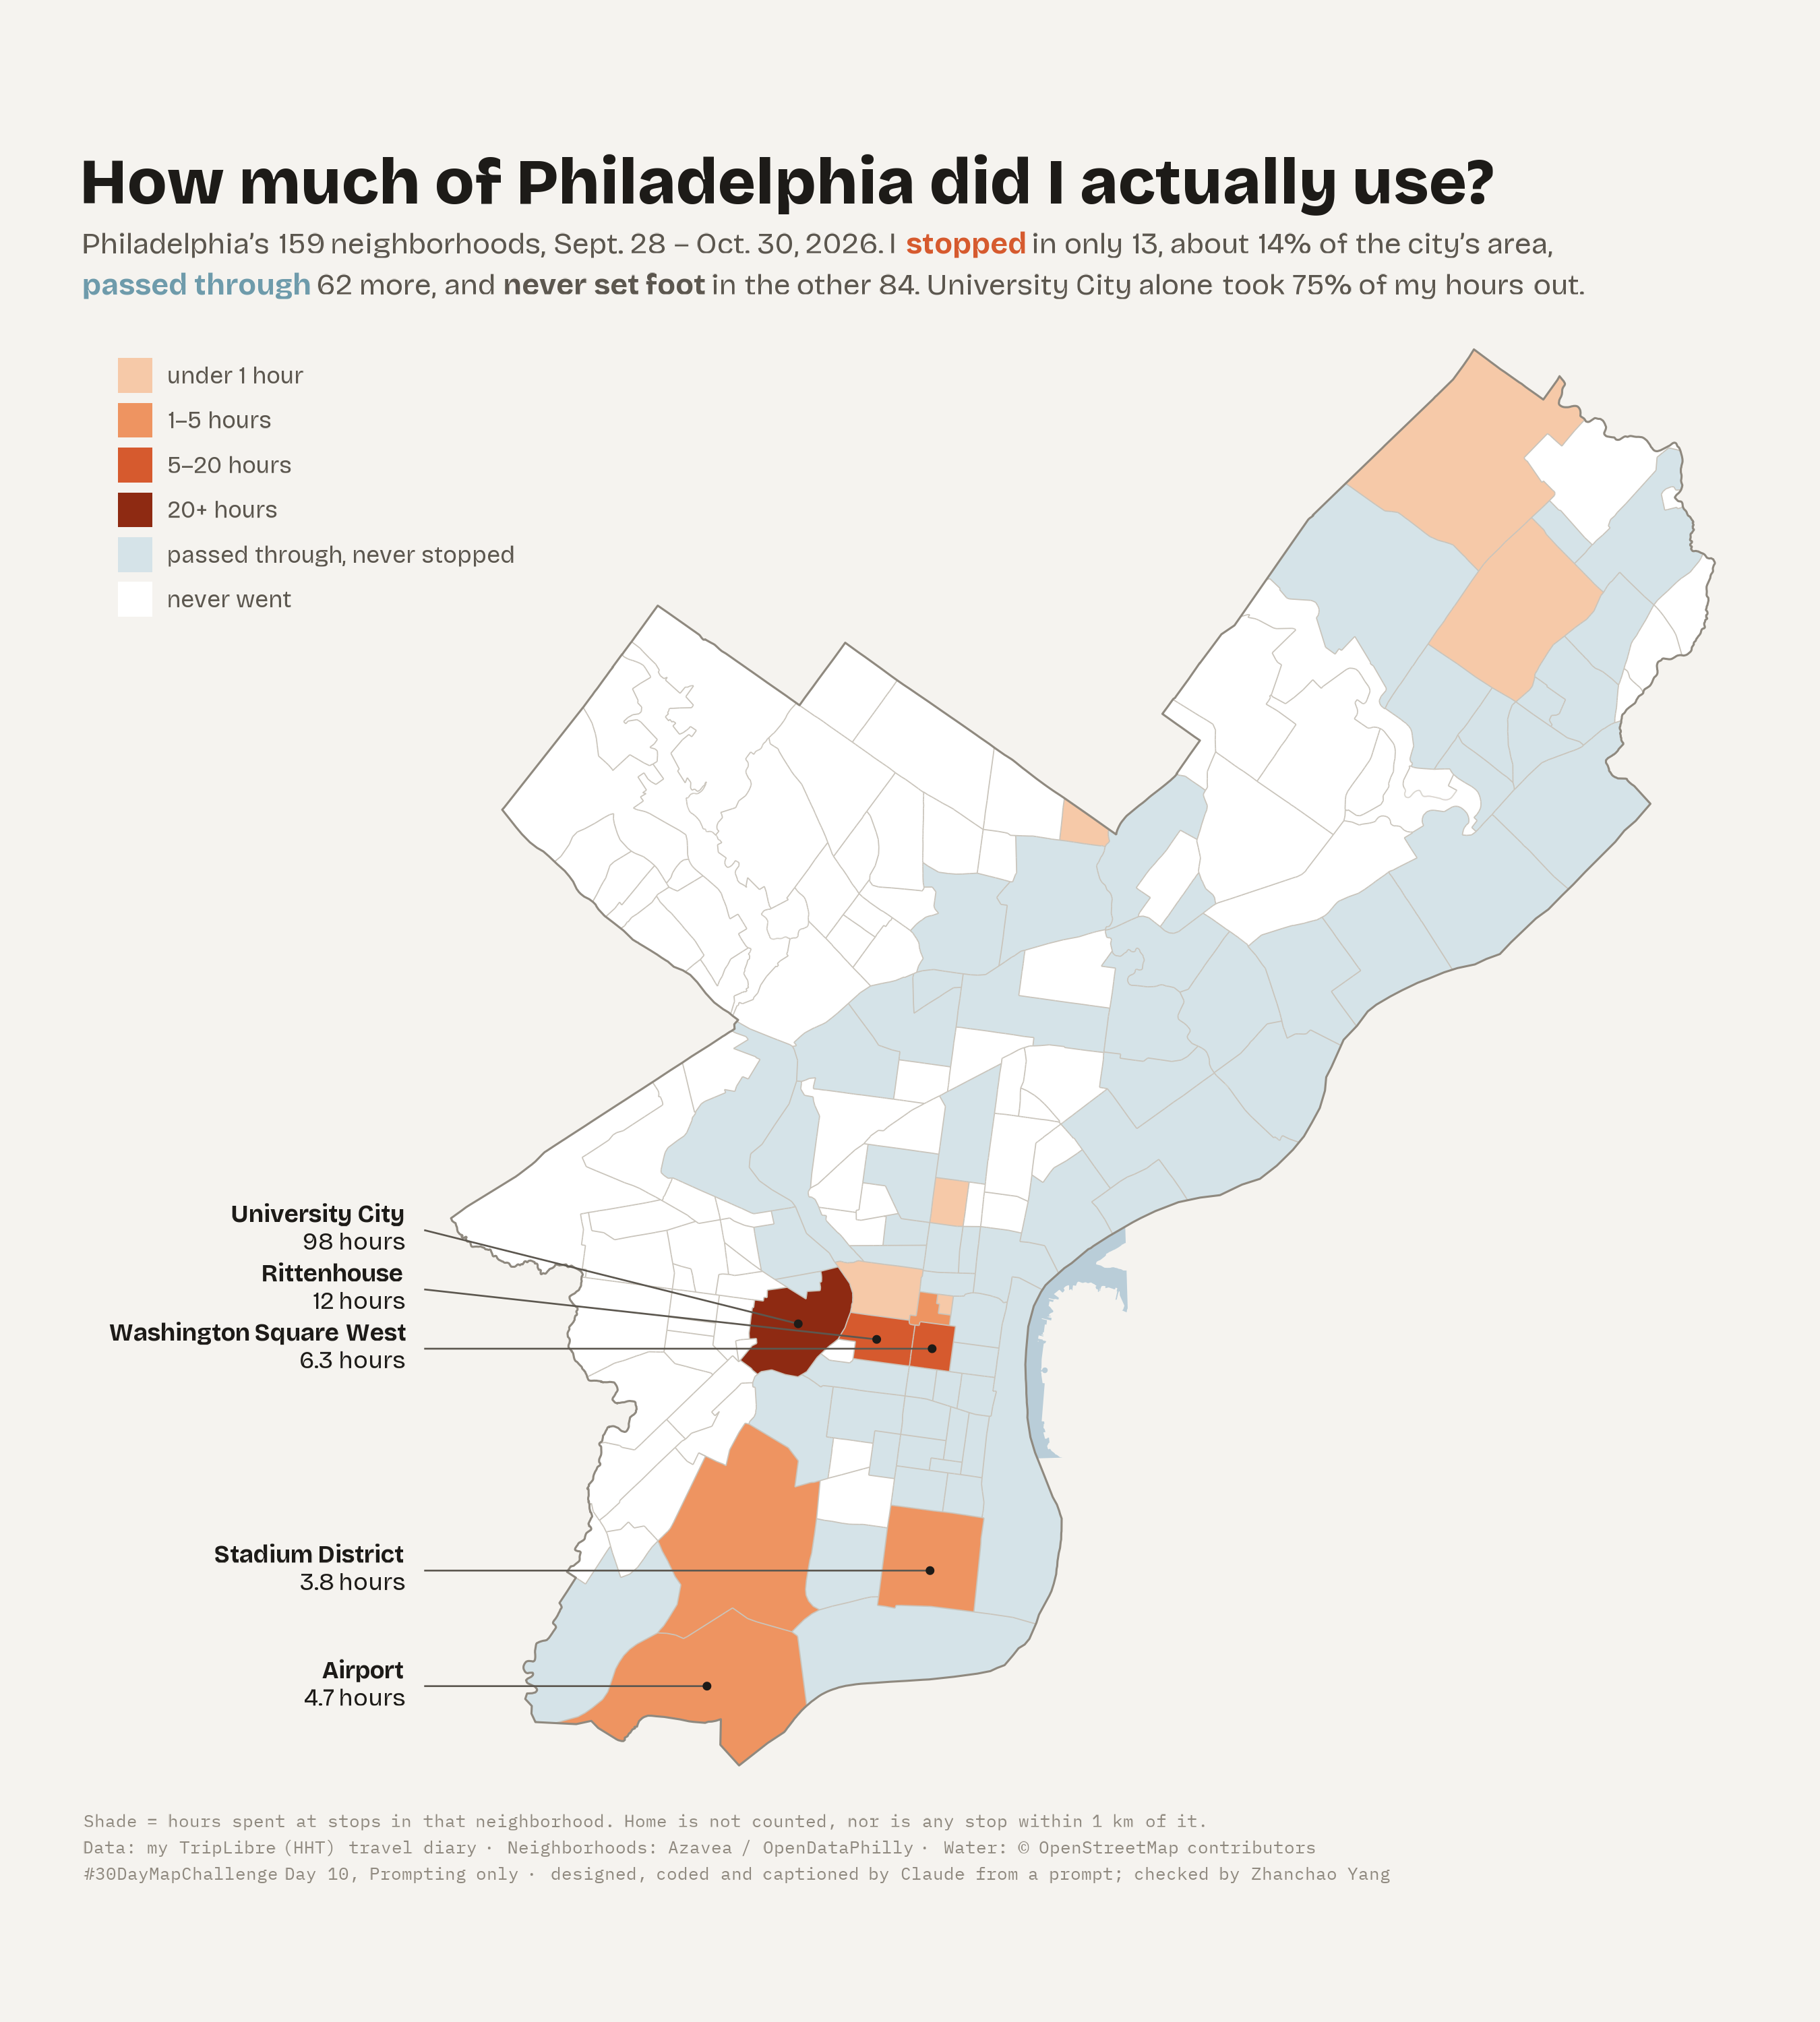
Day 10 (Prompting only): Today’s map was made entirely in a chat with Claude Code on the command line, from my TripLibre travel diary. I wrote no code and picked no design. I only wrote prompts and judged the results. Claude chose the idea, wrote the R script, rendered the map and wrote the caption. The finished map sorts all 159 Philadelphia neighborhoods into three plain groups for Sept. 28 – Oct. 30, 2026: places I stopped (shaded by hours), places I only passed through, and places I never went. I stopped in only 13, about 14% of the city’s area. I passed through 62 more and never set foot in the other 84. University City alone took 75% of my hours out (98 hours).
The prompts, in order (prompts 4 and 5 were originally in Chinese):
- “Today’s map completely up to you, use my TripLibre data (make a map you want to make), only requirement, different than before.”Claude picked a 3D space-time aquarium, Hägerstrand-style. The city lay on the floor, height was the time of day, stops were vertical pillars and trips slanted between them.
- “No one would understand this map, could you make it easier to understand, probably flatten out some lines.”Claude flattened it into a map strip above a train-timetable chart sharing one west–east axis, with one day narrated step by step.
- “It’s still too complicated, try another way.”Claude made a plain dot map of places colored by morning, afternoon or evening: “Days at Penn, nights on Broad Street.”
- “This is pretty much the same as before. Can you make it a bit different?”Claude switched the form itself to a neighborhood choropleth, a form none of my earlier days used, around one question: how much of the city did I actually use?
- “Fix the inconsistent internal boundaries on the map.”Claude found about 250 sliver gaps and 600 tiny overlaps in the neighborhood polygons, cleaned them into a proper coverage and redrew every inner border once.
- “Write an MD in the mapchallenge folder, following the earlier style, but emphasize the prompts we used, in English.”This write-up.
What I learned from prompting only: the first answer was the most ambitious and the least readable. Each round, I gave feedback as a reader (“no one would understand this”, “still too complicated”, “pretty much the same as before”) rather than as a designer. That kind of feedback pushed the map toward one simple question and away from a clever form. Claude kept the facts honest the whole way: every number on the map is computed from the diary, and it fixed its own bugs along the way, such as a share that first came out at 100% and then 0% before it was right.
Technical Implementation:
- AI: Claude Code (Claude Opus 5.5) wrote, ran and visually checked every version of the script from the prompts above. I reviewed the outputs and the privacy rules.
- R with
sf,dplyrandggplot2for classifying neighborhoods and mapping ggtextfor rich-text annotations andshowtextwith Bricolage Grotesque and IBM Plex Mono for typography- Method: a neighborhood is stopped if it holds at least one non-home stop, shaded by total hours there. It is passed through if any recorded trip route crosses it without a stop, and never otherwise. Neighborhood polygons were cleaned into a gap-free, overlap-free coverage before drawing.
- Data: personal TripLibre travel diary export (visits, places & trip routes). The raw data stays private. Home is not counted, nor is any stop within 1 km of it, and results are shown only at neighborhood level.
- Basemap: Philadelphia neighborhoods from Azavea via OpenDataPhilly; water from OpenStreetMap contributors